
Watching builds
mbx tui opens a terminal dashboard (TUI) of live and recent builds that use the same cache directory, with one row per compilation giving its crate name and cache outcome. Open it in a second terminal while a build runs:
mbx tui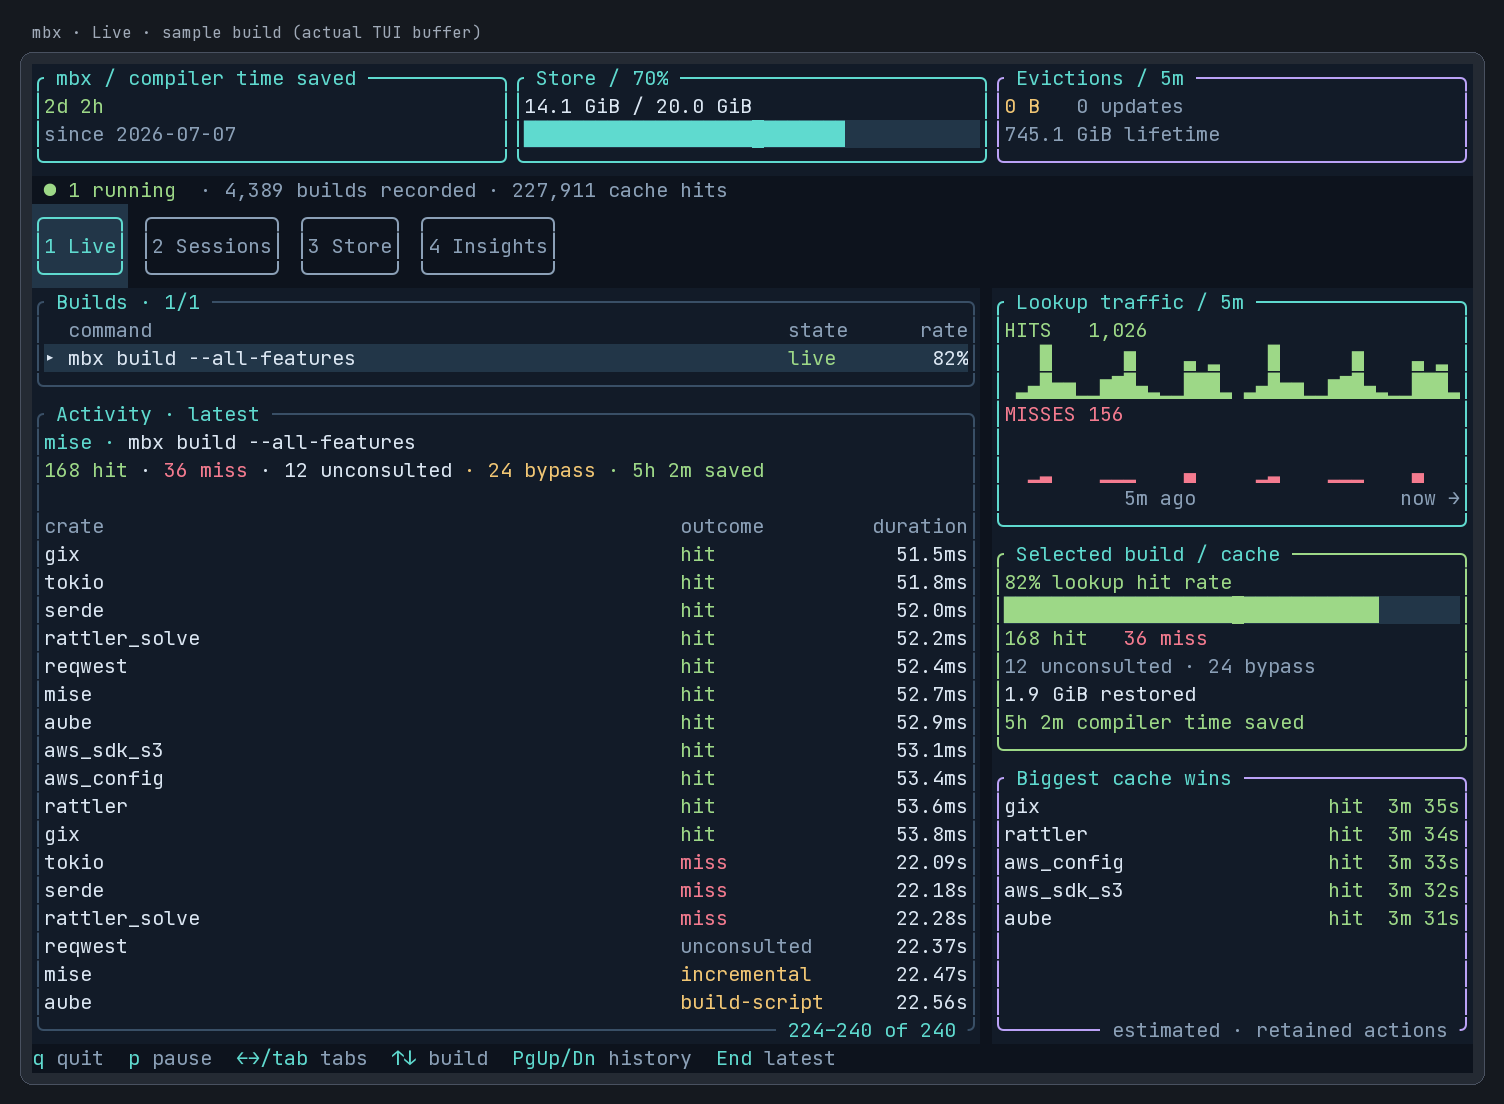
Live, with example build data. Open any screenshot at full size to read the details.
For the build summary mbx prints when a build ends, see Cache results. For the display in the build's own terminal, see Build output in the terminal.
The TUI needs no daemon or cache server. Each build appends its decisions to a session file in the store, and the TUI reads those files. It shows builds from other terminals, builds that started before you opened it, and several builds at once.
Screens
Live lists recorded builds, running builds first and then newest first. For the selected build, it shows the compilations as mbx decides them. Live colors each outcome: green for a hit, red for a miss, grey for a compilation that was not looked up, yellow for a bypass, cyan for a successful verification, and bold purple for a verification mismatch.
The selected build stays visible as you move through the list. The activity panel follows the newest compilations by default. Use Page Up and Page Down to read older activity, up to the build's most recent 2,000 compilations, and End to return to the latest. New events keep arriving while you read history, without shifting the rows you are inspecting. Narrow terminals show fewer build columns; the selected build's counts also appear above its activity.
On wider terminals, Live adds a sidebar with lookup traffic, the selected build's cache-hit gauge, and its biggest compilation savings. The hit and miss graphs share a scale and cover the last five minutes observed by the TUI; idle intervals stay empty. The header groups compiler time saved, store capacity, and evictions into separate metric panels.
The TUI's hit rate counts only attempted lookups (hits and misses), the basis Cache results uses. A build that attempted no lookups shows -, not 0%, because no lookups is not the same as all misses.
Sessions lists every build the TUI follows, with the totals each finished build ended with: the same numbers MBX_STATS_REPORT would have written. A build that is still running or was abandoned shows - for its totals. The TUI follows the newest 50 recorded builds when it opens, plus any that start while it runs. Older builds the store still keeps do not appear in Live, Sessions, or Insights.
Store shows what the store holds and what mbx has saved on this machine since it started counting, with the start date and the compiler time saved. It also shows pruning totals, copying avoided (output bytes restored by reflink or hard link), and estimated workspace sharing; mbx stats explains the figures and prints them without opening the TUI. Use ↑/↓ or Page Up/Page Down to scroll the Store screen. On larger terminals, inventory, lifetime savings, and workspace sharing each get a panel. Smaller terminals, and reports that need more room, use a single scrollable report.
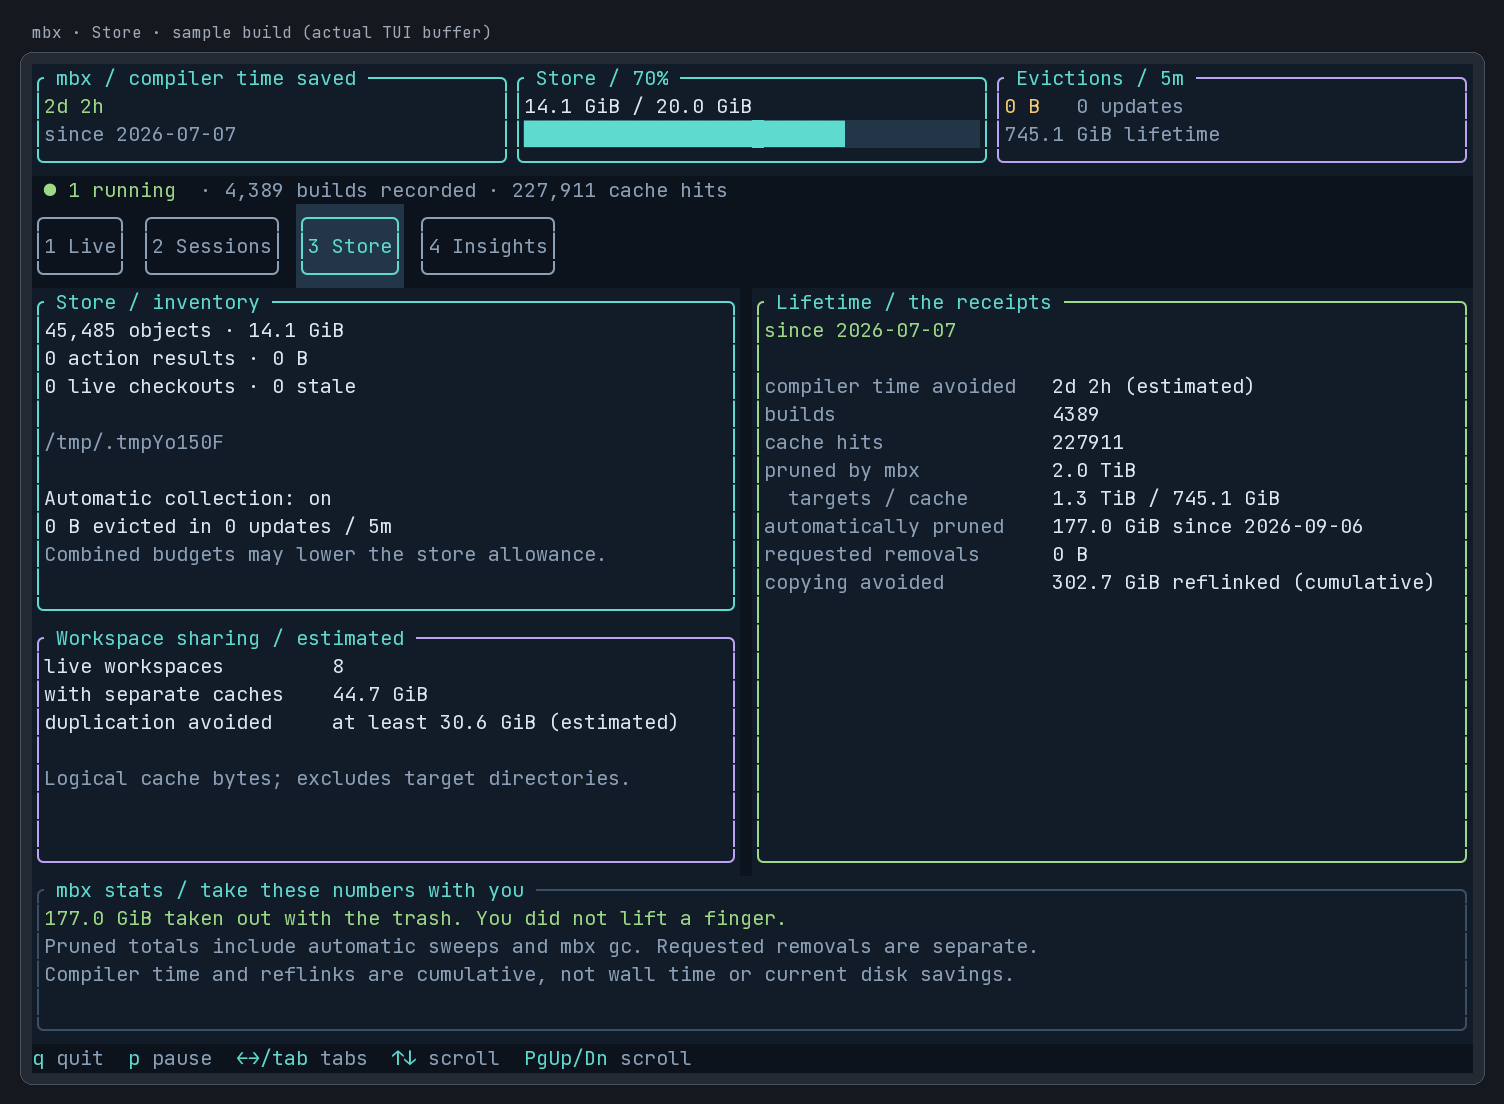
Store, with example build data. Sharing and compiler savings are estimates.
Insights explains the build selected in Live. It calls each recorded compilation an action and shows:
- An outcome chart over all recorded actions, alongside the lookup-only hit rate. Bypassed work and work that was not looked up appear in the chart without lowering that rate.
- A strip of recent outcomes, ordered oldest to newest. Each letter represents one action, not a fixed interval of time. On wider terminals a duration graph below the strip shows which of those actions took the longest.
- Bypass reasons ranked by frequency, with each reason's share of bypasses.
- The slowest recorded actions, with their outcomes. A hit's duration measures restoring outputs; other durations measure compiler work.
- The biggest cache wins, ranked by estimated compiler time avoided, plus total estimated compiler time saved and bytes restored for the build.
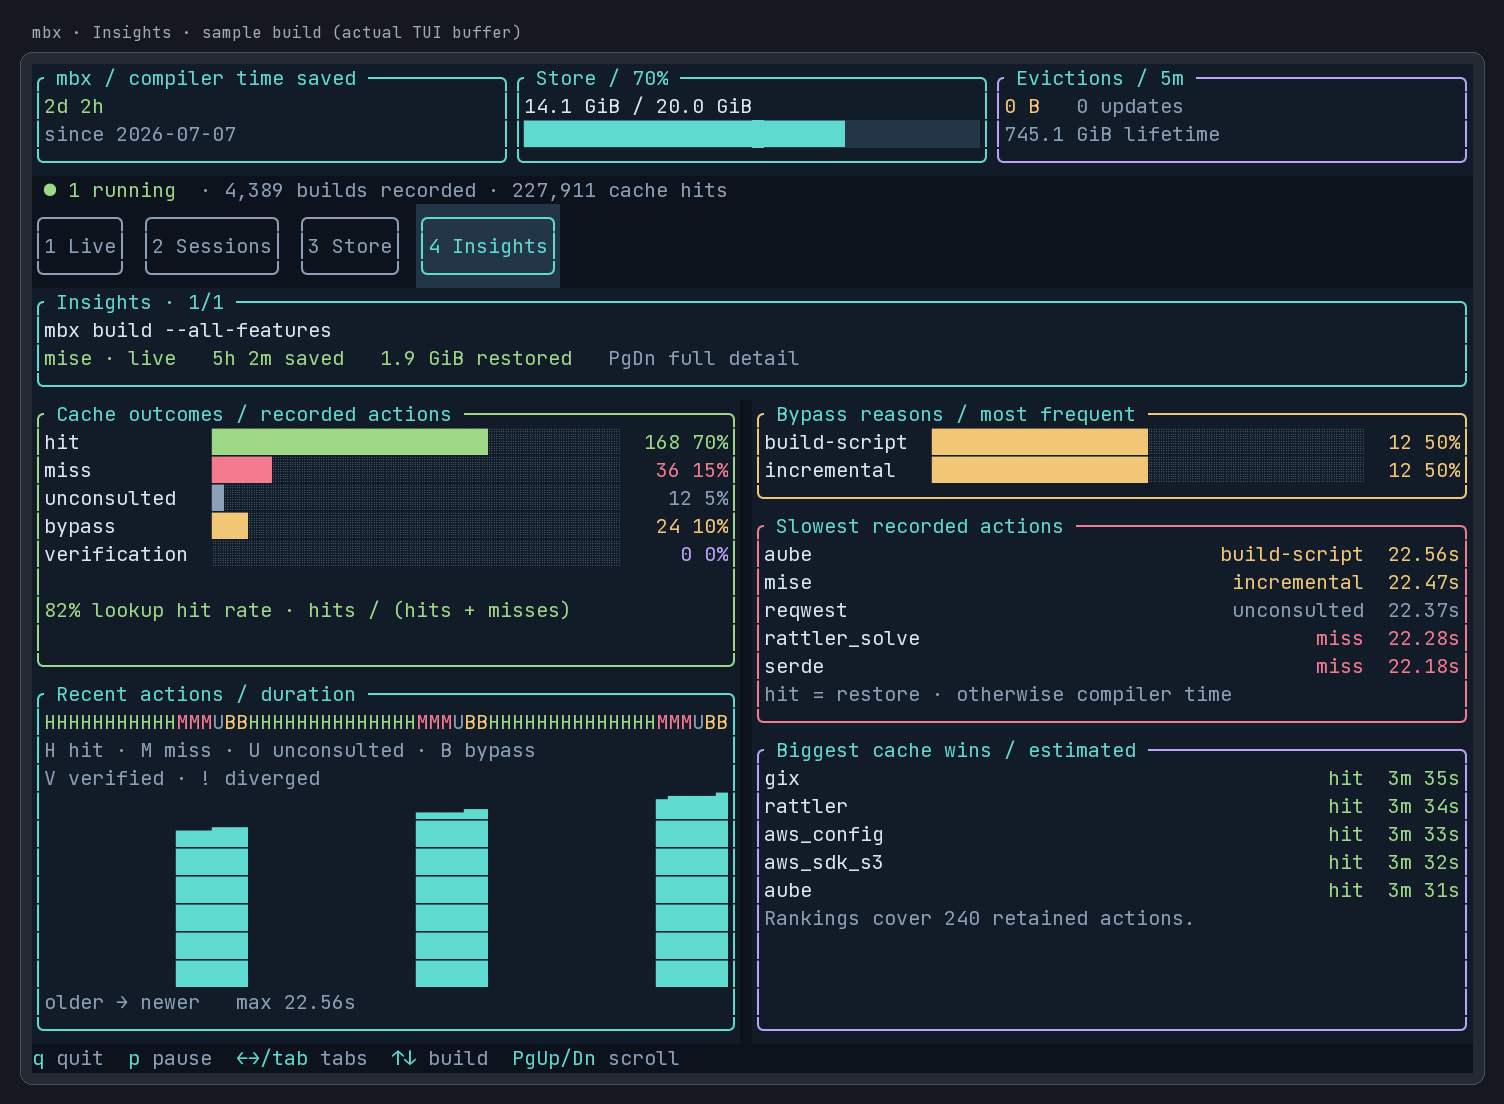
Insights, with example build data. Action durations measure recorded work, not elapsed build time.
Use j/k or ↑/↓ to inspect another build without leaving Insights, and Page Up/Page Down to scroll. Rankings cover the most recent 2,000 retained actions. Charts count recorded actions even after they leave that window. If the build reached its recording cap, Insights marks its data as incomplete. Compiler time saved is cumulative work avoided, not elapsed wall-clock time: compilations can run in parallel.
With enough room, Insights arranges its charts and rankings in a dashboard. Page Down opens the full detail view; Page Up returns to the dashboard.
A build's state is one of:
| State | Meaning |
|---|---|
live | the build is running and still appending |
finished | the build ended and recorded its totals |
abandoned | the build died before it could record them |
abandoned is not an error mbx reports. It means the process writing the session file is gone, so a build killed mid-compile shows up this way instead of appearing to run forever.
Store pressure
The header shows store bytes against the configured gc.max_size budget with an inline usage bar. The bar turns yellow at 90% and red at or above 100%; a store can temporarily exceed its budget between sweeps. This is the action-store budget, not free disk space. A single cache budget covering targets, the store, and incremental state can reduce the actual allowance further. When automatic collection is off, the header and the Store screen say so.
The header also shows evicted bytes for the last five minutes of observation and for the lifetime of the savings ledger that mbx stats reports. These count store collection, including explicit mbx gc, and exclude target-directory cleanup. The recent counter starts when the TUI opens; it does not treat old ledger totals as new evictions. Resuming after a pause starts a new observation period.
A POSSIBLE CACHE THRASHING banner appears on every screen when all of these hold within the last five minutes:
- The eviction counter increased in at least three separate observations.
- Evicted bytes total at least 25% of the configured store budget.
- At least 20 new lookups were observed, with a miss rate of 50% or more.
An observation is one read of the eviction counter, not one collection run; several runs may fall between reads. A single cleanup, a cold build without repeated eviction, and a reset ledger do not trigger the banner. It clears as the observations leave the five-minute window. The banner is a warning heuristic, not proof that eviction caused specific misses.
The banner alternates red and yellow once per second while keeping its text visible, and shows the evicted bytes and the miss rate. The scrollable Store report repeats them and suggests a larger gc.max_size budget and inspecting misses. On larger terminals, the Store screen's panel layout shows the evicted bytes and counter updates for the last five minutes, but not the report's warning line or suggestion; the banner in the header still appears.
Keys
| Key | Action |
|---|---|
q, Esc, Ctrl-C | quit |
Tab, → | next screen |
Shift-Tab, ← | previous screen |
1, 2, 3, 4 | jump to Live, Sessions, Store, Insights |
j, k, ↓, ↑ | select a build in Live or Insights; scroll Sessions or Store |
Page Up, Page Down | browse activity history in Live; scroll Insights or Store |
End | follow the latest activity in Live |
p | pause and resume reading |
Click a tab to switch screens. Click a build in Live to select it, or a row in Sessions to open that build in Live. The mouse wheel selects builds over the Live build list, browses history over Activity, and scrolls the Sessions, Store, and Insights reports. Scrolling up in Activity shows older events; scrolling down returns toward the latest events.
Without a terminal
mbx tui --once prints one plain-text snapshot and exits, for a pipe, a CI log, or a quick look that does not take over the terminal.
mbx tui --oncestore: /home/you/.cache/mbx/actions
objects: 44 (8.6 MiB); action results: 7 (2.5 KiB)
command state hit miss unconsulted bypass
mbx check --workspace live 0 0 4 3
mbx build finished 3 0 0 3
mbx build finished 0 0 3 3Without --once, mbx tui exits with an error when its output is not a terminal. In a terminal smaller than 48 columns by 22 rows, it asks you to enlarge the terminal.
Build output in the terminal
In an interactive terminal, build, check, clippy, run, and test show an animated display adapted from cargo-pretty in place of Cargo's usual output. This applies both to mbx build and to plain cargo build set up to use mbx. The display shows the crates compiling now with their timers, the crates that just finished with each one's cache outcome, and a build bar colored green for hits, yellow for misses, and grey for the rest. Cargo still runs the build, tests, and runners.
mbx uses the display only when all of these hold:
- Standard input, output, and error are all terminals, and the terminal is at least 50 columns by 16 rows.
- The build is not running in CI.
NO_COLORis unset,TERMis notdumb, and neitherCARGO_TERM_COLORnorCARGO_TERM_PROGRESS_WHENisnever.- The command has no
-q/--quiet,-v/--verbose,--message-format,--color, or--configoption. MBX_LOGdoes not enable debug logging.
Otherwise, or if mbx cannot start the display, Cargo prints its usual output. To turn the display off, set display to plain with mbx settings set display plain, or set MBX_DISPLAY=plain for one command. Plain output also hides Cargo's own progress bar.
Warning browser
When a build fails with warnings or test failures, the display opens a browser over them and waits for you to leave it before the command exits:
| Key | Action |
|---|---|
↑, ↓ | select a warning or failure, or scroll the expanded one |
Enter | expand or collapse the selected entry |
Page Up, Page Down | scroll 10 lines |
q, Esc, Ctrl-C | leave the browser |
Set pretty_inspect to true (MBX_PRETTY_INSPECT=1) to open the browser after successful builds with warnings too. Compiler errors and warnings stay in the scrollback either way.
Progress lines in logs
When stderr is not a terminal, as in a CI log or a pipe, or when display is plain, mbx prints a progress line to stderr while build, check, clippy, run, or test runs:
mbx[progress]: 1m 45s elapsed; 312 hits, 4 misses, 0 bypassed, 2 not looked up; ~6m 40s compiler work savedThe first line appears after 15 seconds. Lines then come every 15 seconds until the build has run for two minutes, every minute until 10 minutes, every five minutes until an hour, and every 15 minutes after that. Any of -q/--quiet, -v/--verbose, --message-format, CARGO_TERM_PROGRESS_WHEN=never, summary = "off", or debug logging through MBX_LOG turns them off.
Recording
Recording is on by default. A build appends one short line per compilation directly to its session file, with no buffering, so the dashboard is live. The cost is one small append against a compilation measured in milliseconds. To turn recording off, run mbx settings set events false, or set MBX_EVENTS=0 for one command. mbx still stores cache entries and other build state. While recording is off, mbx tui warns when it starts that builds will not appear and says how to turn recording back on.
Session files live beside the rest of the store's bookkeeping:
<store>/sessions/v1/<session>.jsonl   one line per decision
<store>/sessions/v1/<session>.lock    held for as long as the build runs
The lock shows that a build is still writing its session file. Whoever can take the lock is looking at a build that has ended, however it ended, because the operating system releases the lock when the process exits.
Collection bounds session history automatically. It removes a session file once the file is a week old or is no longer among the newest 256, but never one a build is still writing. A single build stops adding rows after 16 MiB by default, though it still records its totals; change that cap with events_max_size. mbx gc --dry-run reports what it would drop alongside everything else.
Session history does not affect cache keys or count against the action-store size budget. Deleting finished session files removes their rows from the TUI and the history available to mbx explain --last, without removing compiled artifacts.
Not a stable format
The session files are an implementation detail of mbx tui and may change in any release. Scripts should read MBX_STATS_REPORT, which is versioned.
For wrapper phase traces, see Analyzing a build.